
Page 19 - 21st Century Perspective - Glaucoma Supplement
P. 19
Missed Glaucoma
A male patient in his 50s visited our office once he moved to the area. He previously was being followed for 3
years as a glaucoma suspect by an ophthalmologist (it could have just as easily been an optometrist) in his
former city of residence. The patient’s intraocular pressures had always been in the low 20s mm Hg with
normal pachymetry readings, and his optic nerve head had had C/D ratios of about 0.7 in both eyes.
When this patient was seen by one of us, his intraocular pressures were indeed in the low 20s mm Hg, but his
visual fields showed several nasal scotomas. Something did not seem quite right with this picture, so the
patient was asked to return the next morning for a repeat IOP measurement.
The patient was a school teacher and had always been seen by his previous doctor in the late afternoons; his
initial visit with us also was in the late afternoon. Thankfully, it was summertime, and the patient was able to
visit the next morning, as we requested. His intraocular pressures at 8:30 a.m. were in the low 30s mm Hg, and
now the clinical picture made complete sense. When we obtained this patient’s medical records from the
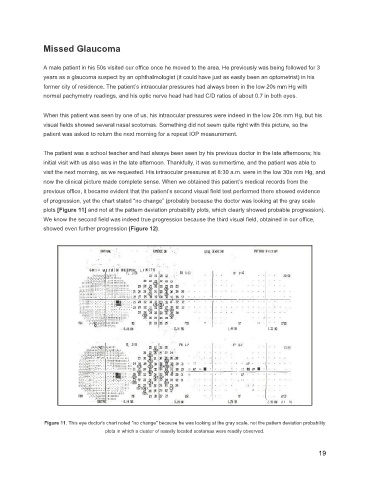
previous office, it became evident that the patient’s second visual field test performed there showed evidence
of progression, yet the chart stated “no change” (probably because the doctor was looking at the gray scale
plots [Figure 11] and not at the pattern deviation probability plots, which clearly showed probable progression).
We know the second field was indeed true progression because the third visual field, obtained in our office,
showed even further progression (Figure 12).
Figure 11. This eye doctor's chart noted "no change" because he was looking at the gray scale, not the pattern deviation probability
plots in which a cluster of nasally located scotomas were readily observed.
19